Example 1: Rectal Bleeding for Prostate Cancer - DVH and NTCP analysis
IMPORTANT: All the data presented in this example has been created using a data generator developed only for validation and demonstration purposes!
Database preparation and biological parameter values estimation
- Create a "Prostate" outcome database.
- All the patient data and DVHs are saved on a regular basis into the database after plan approval.
- Rectal bleeding complications are saved into a specific created field.
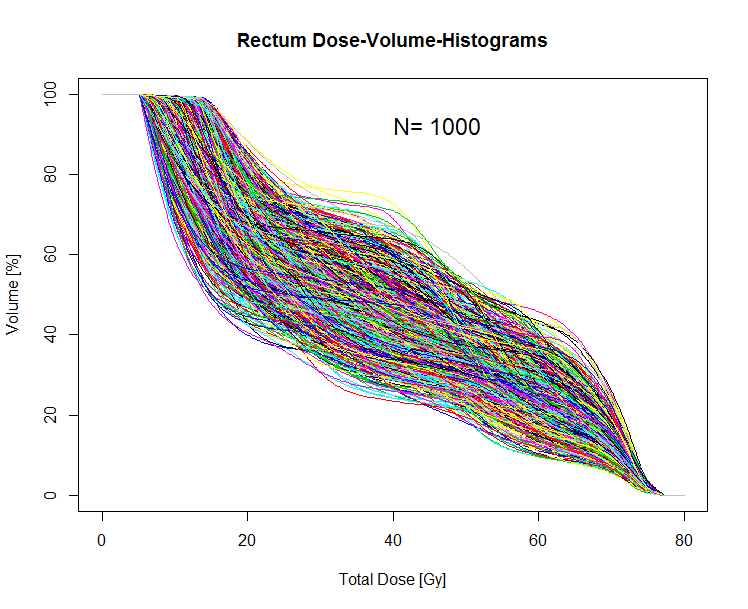
- The database prepared for this example contains 1000 patient's data.
- Using VODCA-DATABASE the database can be filtered sorting out all the DVHs for the structure "Rectum" and Grade 2+ rectal bleeding complications.
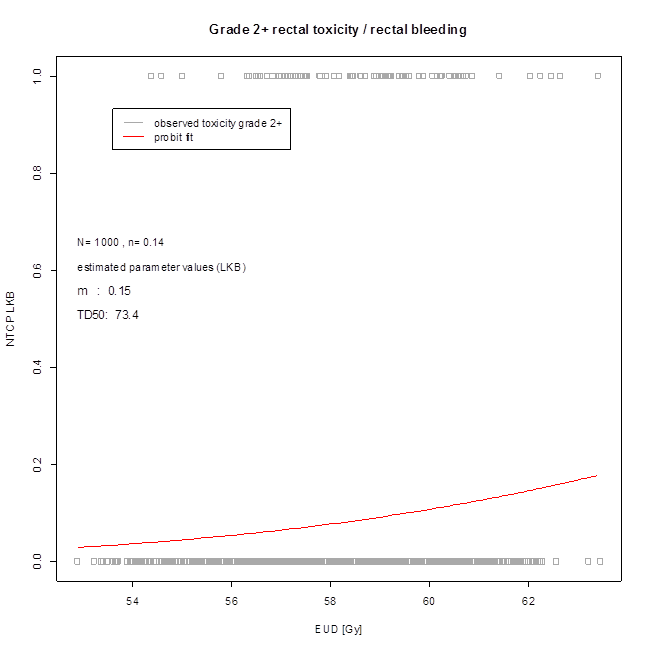
- Using VODCA-R in few seconds you are able to create the following graphs and estimate the parameter values of the NTCP (LKB) model selected for this example.
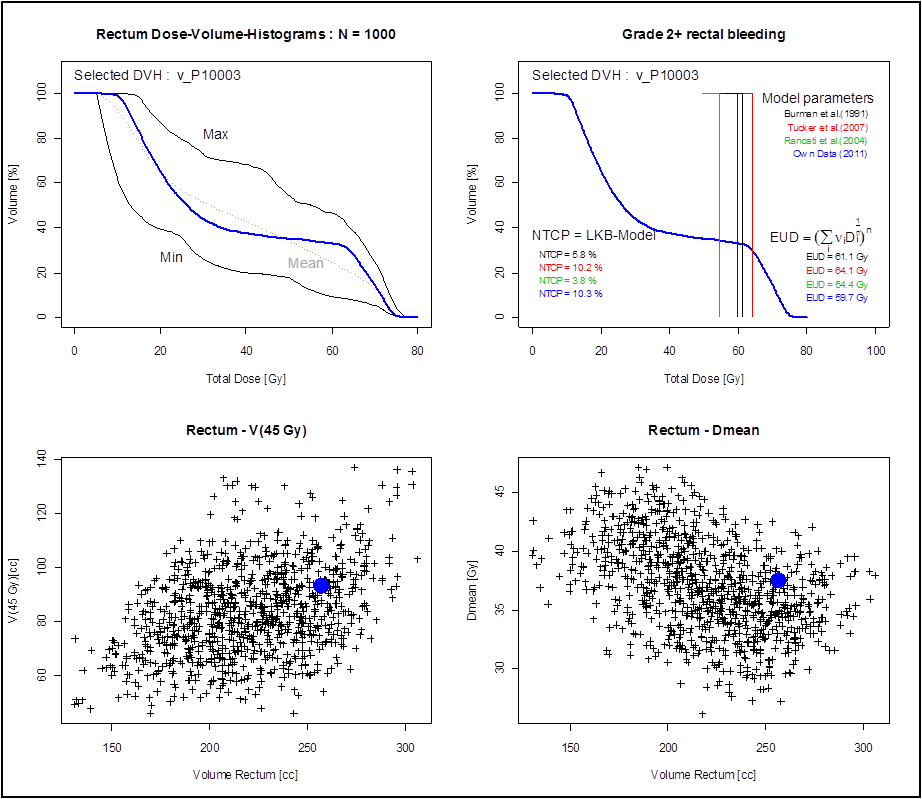
Comparative planning statistics for a new patient
The plan for the new patient (1001) is ready for the discussion before treatment approval.
Using VODCA you can gain from the experience of your already treated patients!
The following graphs show an example of possible comparative planning statistics analysis:
- Comparison of DVHs
- Calculation of NTCP (LKB model) using the model parameter values estimated from the own already treated patients and using parameters values published in the literature.
- Comparison of V(45 Gy) as a function of the structure volume between the new patient and the already treated patients.
- Comparison of the mean dose as a function of the structure volume.
The R package makes it possible to create PDF documents containing not just text, but also tables and charts. The charts can also be saved as separated images for the integration in other reports.
The color "blue" shows the results for the new patient.